Analysing stock prices with F#
This journal demonstrates how to generate elegant reports from your FsLab data analysis. In this demo, we use CSV type provider to read stock prices from Yahoo finance, then we analyze the data using Deedle and we create a couple of charts to visualize the results using R type provider and F# Charting.
Microsoft stock prices
We start by looking at individual time series - here, we use MSFT stock prices. The following snippet shows how to read the data and get time series for the year 2013:
1: 2: 3: 4: 5: 6: 7: 8: 9: |
type Stocks = CsvProvider<"stocks/fb.csv"> let stockPrices name = let prices = Stocks.Load(root + "/stocks/" + name + ".csv") [ for p in prices.Rows -> p.Date, float p.Open ] |> List.rev |> series let msft = stockPrices "AAPL" let msft13 = msft.[DateTime(2013, 1, 1) ..] |
Keys |
1/2/2013 |
1/3/2013 |
1/4/2013 |
1/7/2013 |
1/8/2013 |
... |
11/5/2013 |
11/6/2013 |
11/7/2013 |
|---|---|---|---|---|---|---|---|---|---|
Values |
553.8 |
547.9 |
537 |
522 |
529.2 |
... |
524.6 |
524.2 |
519.6 |
Now we can calculate the average price and draw a line chart:
1:
|
Chart.Line(msft13) |
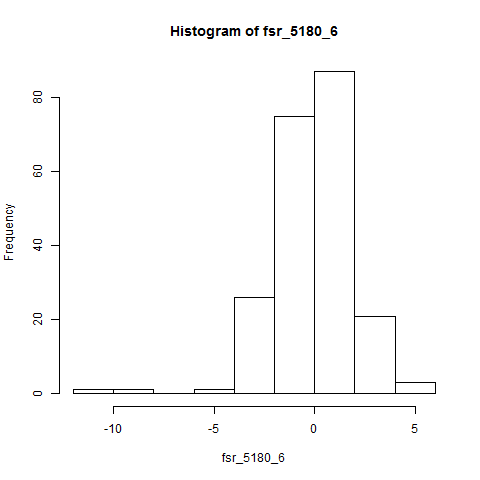
Next, we look at calculating daily returns for the MSFT stock in the year
2013. To do that, we use Series.shift to create a series containing values
for the preceding day. Then we calculate the daily returns. We also use the
R type provider to show a histogram with the values:
1: 2: 3: 4: 5: |
open RProvider open RProvider.graphics let rets = (msft13 - Series.shift 1 msft13) / msft13 * 100.0 R.hist(rets) |
Analysing stocks by sector
In the next example, we look at working with entire data frames rather than with just individual time series. Deedle makes it easy to write calculations over entire data frames, so the code will look very similar to what we wrote before.
We start by loading data for a number of companies in different sectors:
1: 2: 3: 4: 5: 6: 7: 8: 9: 10: |
let names = [ "Technology", "YHOO"; "Technology", "GOOG"; "Technology", "MSFT"; "Technology", "FB" "Financial", "PRU"; "Financial", "V"; "Financial", "AXP.MX"; "Consumer Goods", "AAPL"; "Consumer Goods", "CCE"; "Consumer Goods", "MCD" ] let stocks = frame [ for cat, stock in names -> (cat, stock) => stockPrices stock ] |> Frame.sortRowsByKey |> Frame.sortColsByKey let stocksAll = Frame.dropSparseRows stocks |
(Consumer Goods, AAPL) |
(Consumer Goods, CCE) |
(Consumer Goods, MCD) |
... |
(Technology, GOOG) |
(Technology, MSFT) |
(Technology, YHOO) |
|
|---|---|---|---|---|---|---|---|
5/18/2012 |
534 |
27.9 |
90.21 |
... |
625.1 |
29.79 |
15.78 |
5/21/2012 |
534.5 |
27.31 |
90.01 |
... |
600.5 |
29.1 |
16 |
5/22/2012 |
569.6 |
27.74 |
91.96 |
... |
613.4 |
29.69 |
15.58 |
5/23/2012 |
557.5 |
27.18 |
90.97 |
... |
601.7 |
29.35 |
15.19 |
5/24/2012 |
575.9 |
27.29 |
91.86 |
... |
609.2 |
29.16 |
15.34 |
5/25/2012 |
564.6 |
27.35 |
91.65 |
... |
601 |
29.2 |
15.4 |
5/29/2012 |
570.9 |
27.79 |
91.41 |
... |
595.8 |
29.38 |
15.4 |
5/30/2012 |
569.2 |
27.68 |
90.4 |
... |
588.2 |
29.35 |
15.3 |
... |
... |
... |
... |
... |
... |
... |
... |
11/4/2013 |
521.1 |
41.65 |
97.26 |
... |
1032 |
35.59 |
33.2 |
11/5/2013 |
524.6 |
41.39 |
97.38 |
... |
1020 |
35.79 |
33.03 |
11/6/2013 |
524.2 |
41.18 |
97.66 |
... |
1026 |
37.24 |
33.07 |
11/7/2013 |
519.6 |
41.64 |
97.96 |
... |
1023 |
37.96 |
32.99 |
Standard F# numerical operators can work on frames just like they worked on series.
This means that the calculation of returns on frames looks just like the calculation
on series. We just need to replace Series.shift with Frame.shift:
1:
|
let stocksAllRets = (stocksAll - (Frame.shift 1 stocksAll)) / stocksAll * 100.0 |
Finally, we calculate averages and visualize the summarized results using the F# Charting library. The following snippet creates a chart showing averages per companies:
1: 2: 3: 4: |
stocksAllRets |> Stats.mean |> Series.mapKeys snd |> Chart.Column |
The following snippet performs similar calculation, but averages returns per sector:
1: 2: 3: 4: |
stocksAllRets |> Stats.mean |> Stats.levelMean fst |> Chart.Column |
from XPlot.GoogleCharts
Full name: Tutorial.root
Full name: Tutorial.Stocks
Full name: FSharp.Data.CsvProvider
<summary>Typed representation of a CSV file.</summary>
<param name='Sample'>Location of a CSV sample file or a string containing a sample CSV document.</param>
<param name='Separators'>Column delimiter(s). Defaults to `,`.</param>
<param name='InferRows'>Number of rows to use for inference. Defaults to `1000`. If this is zero, all rows are used.</param>
<param name='Schema'>Optional column types, in a comma separated list. Valid types are `int`, `int64`, `bool`, `float`, `decimal`, `date`, `guid`, `string`, `int?`, `int64?`, `bool?`, `float?`, `decimal?`, `date?`, `guid?`, `int option`, `int64 option`, `bool option`, `float option`, `decimal option`, `date option`, `guid option` and `string option`.
You can also specify a unit and the name of the column like this: `Name (type<unit>)`, or you can override only the name. If you don't want to specify all the columns, you can reference the columns by name like this: `ColumnName=type`.</param>
<param name='HasHeaders'>Whether the sample contains the names of the columns as its first line.</param>
<param name='IgnoreErrors'>Whether to ignore rows that have the wrong number of columns or which can't be parsed using the inferred or specified schema. Otherwise an exception is thrown when these rows are encountered.</param>
<param name='SkipRows'>SKips the first n rows of the CSV file.</param>
<param name='AssumeMissingValues'>When set to true, the type provider will assume all columns can have missing values, even if in the provided sample all values are present. Defaults to false.</param>
<param name='PreferOptionals'>When set to true, inference will prefer to use the option type instead of nullable types, `double.NaN` or `""` for missing values. Defaults to false.</param>
<param name='Quote'>The quotation mark (for surrounding values containing the delimiter). Defaults to `"`.</param>
<param name='MissingValues'>The set of strings recogized as missing values. Defaults to `NaN,NA,#N/A,:,-,TBA,TBD`.</param>
<param name='CacheRows'>Whether the rows should be caches so they can be iterated multiple times. Defaults to true. Disable for large datasets.</param>
<param name='Culture'>The culture used for parsing numbers and dates. Defaults to the invariant culture.</param>
<param name='Encoding'>The encoding used to read the sample. You can specify either the character set name or the codepage number. Defaults to UTF8 for files, and to ISO-8859-1 the for HTTP requests, unless `charset` is specified in the `Content-Type` response header.</param>
<param name='ResolutionFolder'>A directory that is used when resolving relative file references (at design time and in hosted execution).</param>
<param name='EmbeddedResource'>When specified, the type provider first attempts to load the sample from the specified resource
(e.g. 'MyCompany.MyAssembly, resource_name.csv'). This is useful when exposing types generated by the type provider.</param>
Full name: Tutorial.stockPrices
Loads CSV from the specified uri
CsvProvider<...>.Load(reader: IO.TextReader) : CsvProvider<...>
Loads CSV from the specified reader
CsvProvider<...>.Load(stream: IO.Stream) : CsvProvider<...>
Loads CSV from the specified stream
val float : value:'T -> float (requires member op_Explicit)
Full name: Microsoft.FSharp.Core.Operators.float
--------------------
type float = Double
Full name: Microsoft.FSharp.Core.float
--------------------
type float<'Measure> = float
Full name: Microsoft.FSharp.Core.float<_>
module List
from Microsoft.FSharp.Collections
--------------------
type List<'T> =
| ( [] )
| ( :: ) of Head: 'T * Tail: 'T list
interface IEnumerable
interface IEnumerable<'T>
member Head : 'T
member IsEmpty : bool
member Item : index:int -> 'T with get
member Length : int
member Tail : 'T list
static member Cons : head:'T * tail:'T list -> 'T list
static member Empty : 'T list
Full name: Microsoft.FSharp.Collections.List<_>
Full name: Microsoft.FSharp.Collections.List.rev
Full name: Deedle.FSharpSeriesExtensions.series
Full name: Tutorial.msft
Full name: Tutorial.msft13
type DateTime =
struct
new : ticks:int64 -> DateTime + 10 overloads
member Add : value:TimeSpan -> DateTime
member AddDays : value:float -> DateTime
member AddHours : value:float -> DateTime
member AddMilliseconds : value:float -> DateTime
member AddMinutes : value:float -> DateTime
member AddMonths : months:int -> DateTime
member AddSeconds : value:float -> DateTime
member AddTicks : value:int64 -> DateTime
member AddYears : value:int -> DateTime
...
end
Full name: System.DateTime
--------------------
DateTime()
(+0 other overloads)
DateTime(ticks: int64) : unit
(+0 other overloads)
DateTime(ticks: int64, kind: DateTimeKind) : unit
(+0 other overloads)
DateTime(year: int, month: int, day: int) : unit
(+0 other overloads)
DateTime(year: int, month: int, day: int, calendar: Globalization.Calendar) : unit
(+0 other overloads)
DateTime(year: int, month: int, day: int, hour: int, minute: int, second: int) : unit
(+0 other overloads)
DateTime(year: int, month: int, day: int, hour: int, minute: int, second: int, kind: DateTimeKind) : unit
(+0 other overloads)
DateTime(year: int, month: int, day: int, hour: int, minute: int, second: int, calendar: Globalization.Calendar) : unit
(+0 other overloads)
DateTime(year: int, month: int, day: int, hour: int, minute: int, second: int, millisecond: int) : unit
(+0 other overloads)
DateTime(year: int, month: int, day: int, hour: int, minute: int, second: int, millisecond: int, kind: DateTimeKind) : unit
(+0 other overloads)
static member Annotation : data:seq<#seq<DateTime * 'V * string * string>> * ?Labels:seq<string> * ?Options:Options -> GoogleChart (requires 'V :> value)
static member Annotation : data:seq<DateTime * #value * string * string> * ?Labels:seq<string> * ?Options:Options -> GoogleChart
static member Area : data:seq<#seq<'K * 'V>> * ?Labels:seq<string> * ?Options:Options -> GoogleChart (requires 'K :> key and 'V :> value)
static member Area : data:seq<#key * #value> * ?Labels:seq<string> * ?Options:Options -> GoogleChart
static member Bar : data:seq<#seq<'K * 'V>> * ?Labels:seq<string> * ?Options:Options -> GoogleChart (requires 'K :> key and 'V :> value)
static member Bar : data:seq<#key * #value> * ?Labels:seq<string> * ?Options:Options -> GoogleChart
static member Bubble : data:seq<string * #value * #value * #value * #value> * ?Labels:seq<string> * ?Options:Options -> GoogleChart
static member Bubble : data:seq<string * #value * #value * #value> * ?Labels:seq<string> * ?Options:Options -> GoogleChart
static member Bubble : data:seq<string * #value * #value> * ?Labels:seq<string> * ?Options:Options -> GoogleChart
static member Calendar : data:seq<DateTime * #value> * ?Labels:seq<string> * ?Options:Options -> GoogleChart
...
Full name: XPlot.GoogleCharts.Chart
static member Chart.Line : data:Series<'K,#value> * ?Labels:seq<string> * ?Options:Options -> GoogleChart (requires equality and 'K :> key)
static member Chart.Line : data:seq<Series<'K,#value>> * ?Labels:seq<string> * ?Options:Options -> GoogleChart (requires equality and 'K :> key)
static member Chart.Line : data:seq<#seq<'K * 'V>> * ?Labels:seq<string> * ?Options:Options -> GoogleChart (requires 'K :> key and 'V :> value)
static member Chart.Line : data:seq<#key * #value> * ?Labels:seq<string> * ?Options:Options -> GoogleChart
Full name: Tutorial.rets
module Series
from Deedle
--------------------
type Series =
new : ?type:string -> Series
member ShouldSerializeannotations : unit -> bool
member ShouldSerializeareaOpacity : unit -> bool
member ShouldSerializecolor : unit -> bool
member ShouldSerializecurveType : unit -> bool
member ShouldSerializefallingColor : unit -> bool
member ShouldSerializelineWidth : unit -> bool
member ShouldSerializepointShape : unit -> bool
member ShouldSerializepointSize : unit -> bool
member ShouldSerializerisingColor : unit -> bool
...
Full name: XPlot.GoogleCharts.Configuration.Series
--------------------
type Series<'K,'V (requires equality)> =
interface IFsiFormattable
interface ISeries<'K>
new : pairs:seq<KeyValuePair<'K,'V>> -> Series<'K,'V>
new : keys:'K [] * values:'V [] -> Series<'K,'V>
new : keys:seq<'K> * values:seq<'V> -> Series<'K,'V>
new : index:IIndex<'K> * vector:IVector<'V> * vectorBuilder:IVectorBuilder * indexBuilder:IIndexBuilder -> Series<'K,'V>
member After : lowerExclusive:'K -> Series<'K,'V>
member Aggregate : aggregation:Aggregation<'K> * observationSelector:Func<DataSegment<Series<'K,'V>>,KeyValuePair<'TNewKey,OptionalValue<'R>>> -> Series<'TNewKey,'R> (requires equality)
member Aggregate : aggregation:Aggregation<'K> * keySelector:Func<DataSegment<Series<'K,'V>>,'TNewKey> * valueSelector:Func<DataSegment<Series<'K,'V>>,OptionalValue<'R>> -> Series<'TNewKey,'R> (requires equality)
member AsyncMaterialize : unit -> Async<Series<'K,'V>>
...
Full name: Deedle.Series<_,_>
--------------------
new : ?type:string -> Series
--------------------
new : pairs:seq<Collections.Generic.KeyValuePair<'K,'V>> -> Series<'K,'V>
new : keys:seq<'K> * values:seq<'V> -> Series<'K,'V>
new : keys:'K [] * values:'V [] -> Series<'K,'V>
new : index:Indices.IIndex<'K> * vector:IVector<'V> * vectorBuilder:Vectors.IVectorBuilder * indexBuilder:Indices.IIndexBuilder -> Series<'K,'V>
Full name: Deedle.Series.shift
static member Axis : ?x: obj * ?at: obj * ?___: obj * ?side: obj * ?labels: obj * ?paramArray: obj [] -> SymbolicExpression + 1 overload
static member abline : ?a: obj * ?b: obj * ?h: obj * ?v: obj * ?reg: obj * ?coef: obj * ?untf: obj * ?___: obj * ?paramArray: obj [] -> SymbolicExpression + 1 overload
static member arrows : ?x0: obj * ?y0: obj * ?x1: obj * ?y1: obj * ?length: obj * ?angle: obj * ?code: obj * ?col: obj * ?lty: obj * ?lwd: obj * ?___: obj * ?paramArray: obj [] -> SymbolicExpression + 1 overload
static member assocplot : ?x: obj * ?col: obj * ?space: obj * ?main: obj * ?xlab: obj * ?ylab: obj -> SymbolicExpression + 1 overload
static member axTicks : ?side: obj * ?axp: obj * ?usr: obj * ?log: obj * ?nintLog: obj -> SymbolicExpression + 1 overload
static member axis : ?side: obj * ?at: obj * ?labels: obj * ?tick: obj * ?line: obj * ?pos: obj * ?outer: obj * ?font: obj * ?lty: obj * ?lwd: obj * ?lwd_ticks: obj * ?col: obj * ?col_ticks: obj * ?hadj: obj * ?padj: obj * ?___: obj * ?paramArray: obj [] -> SymbolicExpression + 1 overload
static member axis_Date : ?side: obj * ?x: obj * ?at: obj * ?format: obj * ?labels: obj * ?___: obj * ?paramArray: obj [] -> SymbolicExpression + 1 overload
static member axis_POSIXct : ?side: obj * ?x: obj * ?at: obj * ?format: obj * ?labels: obj * ?___: obj * ?paramArray: obj [] -> SymbolicExpression + 1 overload
static member barplot : ?height: obj * ?___: obj * ?paramArray: obj [] -> SymbolicExpression + 1 overload
static member barplot_default : ?height: obj * ?width: obj * ?space: obj * ?names_arg: obj * ?legend_text: obj * ?beside: obj * ?horiz: obj * ?density: obj * ?angle: obj * ?col: obj * ?border: obj * ?main: obj * ?sub: obj * ?xlab: obj * ?ylab: obj * ?xlim: obj * ?ylim: obj * ?xpd: obj * ?log: obj * ?axes: obj * ?axisnames: obj * ?cex_axis: obj * ?cex_names: obj * ?inside: obj * ?plot: obj * ?axis_lty: obj * ?offset: obj * ?add: obj * ?args_legend: obj * ?___: obj * ?paramArray: obj [] -> SymbolicExpression + 1 overload
...
Full name: RProvider.graphics.R
R functions for base graphics.
R.hist(?x: obj, ?___: obj, ?paramArray: obj []) : RDotNet.SymbolicExpression
Histograms
Full name: Tutorial.names
Full name: Tutorial.stocks
Full name: Deedle.FSharpFrameExtensions.frame
module Frame
from Deedle
--------------------
type Frame =
static member CreateEmpty : unit -> Frame<'R,'C> (requires equality and equality)
static member FromArray2D : array:'T [,] -> Frame<int,int>
static member FromColumns : cols:Series<'TColKey,Series<'TRowKey,'V>> -> Frame<'TRowKey,'TColKey> (requires equality and equality)
static member FromColumns : cols:Series<'TColKey,ObjectSeries<'TRowKey>> -> Frame<'TRowKey,'TColKey> (requires equality and equality)
static member FromColumns : columns:seq<KeyValuePair<'ColKey,ObjectSeries<'RowKey>>> -> Frame<'RowKey,'ColKey> (requires equality and equality)
static member FromColumns : columns:seq<KeyValuePair<'ColKey,Series<'RowKey,'V>>> -> Frame<'RowKey,'ColKey> (requires equality and equality)
static member FromColumns : cols:seq<Series<'ColKey,'V>> -> Frame<'ColKey,int> (requires equality)
static member FromRecords : values:seq<'T> -> Frame<int,string>
static member FromRecords : series:Series<'K,'R> -> Frame<'K,string> (requires equality)
static member FromRowKeys : keys:seq<'K> -> Frame<'K,string> (requires equality)
...
Full name: Deedle.Frame
--------------------
type Frame<'TRowKey,'TColumnKey (requires equality and equality)> =
interface IDynamicMetaObjectProvider
interface INotifyCollectionChanged
interface IFsiFormattable
interface IFrame
new : names:seq<'TColumnKey> * columns:seq<ISeries<'TRowKey>> -> Frame<'TRowKey,'TColumnKey>
new : rowIndex:IIndex<'TRowKey> * columnIndex:IIndex<'TColumnKey> * data:IVector<IVector> * indexBuilder:IIndexBuilder * vectorBuilder:IVectorBuilder -> Frame<'TRowKey,'TColumnKey>
member AddColumn : column:'TColumnKey * series:ISeries<'TRowKey> -> unit
member AddColumn : column:'TColumnKey * series:seq<'V> -> unit
member AddColumn : column:'TColumnKey * series:ISeries<'TRowKey> * lookup:Lookup -> unit
member AddColumn : column:'TColumnKey * series:seq<'V> * lookup:Lookup -> unit
...
Full name: Deedle.Frame<_,_>
--------------------
new : names:seq<'TColumnKey> * columns:seq<ISeries<'TRowKey>> -> Frame<'TRowKey,'TColumnKey>
new : rowIndex:Indices.IIndex<'TRowKey> * columnIndex:Indices.IIndex<'TColumnKey> * data:IVector<IVector> * indexBuilder:Indices.IIndexBuilder * vectorBuilder:Vectors.IVectorBuilder -> Frame<'TRowKey,'TColumnKey>
Full name: Deedle.Frame.sortRowsByKey
Full name: Deedle.Frame.sortColsByKey
Full name: Tutorial.stocksAll
Full name: Deedle.Frame.dropSparseRows
Full name: Tutorial.stocksAllRets
Full name: Deedle.Frame.shift
static member count : frame:Frame<'R,'C> -> Series<'C,int> (requires equality and equality)
static member count : series:Series<'K,'V> -> int (requires equality)
static member expandingCount : series:Series<'K,float> -> Series<'K,float> (requires equality)
static member expandingKurt : series:Series<'K,float> -> Series<'K,float> (requires equality)
static member expandingMax : series:Series<'K,float> -> Series<'K,float> (requires equality)
static member expandingMean : series:Series<'K,float> -> Series<'K,float> (requires equality)
static member expandingMin : series:Series<'K,float> -> Series<'K,float> (requires equality)
static member expandingSkew : series:Series<'K,float> -> Series<'K,float> (requires equality)
static member expandingStdDev : series:Series<'K,float> -> Series<'K,float> (requires equality)
static member expandingSum : series:Series<'K,float> -> Series<'K,float> (requires equality)
...
Full name: Deedle.Stats
static member Stats.mean : series:Series<'K,float> -> float (requires equality)
Full name: Deedle.Series.mapKeys
Full name: Microsoft.FSharp.Core.Operators.snd
static member Chart.Column : data:Series<'K,#value> * ?Labels:seq<string> * ?Options:Options -> GoogleChart (requires equality and 'K :> key)
static member Chart.Column : data:seq<Series<'K,#value>> * ?Labels:seq<string> * ?Options:Options -> GoogleChart (requires equality and 'K :> key)
static member Chart.Column : data:seq<#seq<'K * 'V>> * ?Labels:seq<string> * ?Options:Options -> GoogleChart (requires 'K :> key and 'V :> value)
static member Chart.Column : data:seq<#key * #value> * ?Labels:seq<string> * ?Options:Options -> GoogleChart
Full name: Microsoft.FSharp.Core.Operators.fst